Technical Portfolio
Data & Analytics
Examples of how I use data architecture, Python pipelines, and experimentation to drive growth and measure success.
Telecom Customer Churn Prediction
End-to-end ML pipeline: From SQL to AWS deployment
Context
Built a production-ready churn prediction system to help telecom providers identify at-risk customers before they leave. Full pipeline from data cleaning through cloud deployment.
The Challenge
Telecom customer data is messy - missing values, inconsistent formats, imbalanced classes (only 26.5% churn rate). Needed to build a model that could handle real-world data quality issues, predict churn with high precision, deploy reliably in production, and provide explainable results for business stakeholders.
Technical Architecture
↓
SQL: Data validation & cleaning
↓
Python/pandas: Feature engineering
↓
scikit-learn: Model training (Random Forest, Logistic Regression, XGBoost)
↓
Flask API: RESTful endpoint
↓
Docker: Containerization
↓
AWS EC2: Production deployment
Integrating MySQL with Python
import pandas as pd
from sqlalchemy import create_engine

# Database connection setup
ENDPOINT = 'xxxx'
PORT = xx
USERNAME = 'xx'
PASSWORD = 'xx'
DBNAME = 'car_insurance'

# Create SQLAlchemy engine
database_conn = create_engine(
  f'mysql+pymysql://{USERNAME}:{PASSWORD}@{ENDPOINT}/{DBNAME}'
)

# Execute query and load into DataFrame
df = pd.read_sql(query, database_conn)
df
Finding Feature Correlation (Python)
import numpy as np

# Compute correlation matrix - use iteratively to prune
# Ensure all feature correlation < 0.85
# Previously identified highly correlated pairs:
# - total_premium_services - total_services: 0.93
# - total_basic_services - internet_type_Unknown: -0.86

corr_matrix = eng_clean_cust_churn_df.corr()

# Create a mask for the upper triangle
mask = np.triu(np.ones_like(corr_matrix, dtype=bool))

# Plot heatmap
plt.figure(figsize=(12, 8))
sns.heatmap(corr_matrix, mask=mask, annot=False,
            cmap="coolwarm", linewidths=0.5)
plt.title("Feature Correlation Heatmap")
plt.show()

# Identify highly correlated features (threshold: 0.7)
corr_threshold = 0.7
corr_pairs = corr_matrix.where(
  np.triu(np.ones(corr_matrix.shape), k=1).astype(bool)
)

# Extract feature pairs with high correlation
high_corr_pairs = [
  (col1, col2, corr_pairs.loc[col1, col2])
  for col1 in corr_pairs.columns
  for col2 in corr_pairs.index
  if abs(corr_pairs.loc[col1, col2]) > corr_threshold
]

# Sort by absolute correlation value
high_corr_pairs = sorted(
  high_corr_pairs,
  key=lambda x: abs(x[2]),
  reverse=True
)

# Print results
print("Highly Correlated Feature Pairs:")
for col1, col2, corr_value in high_corr_pairs:
  print(f"{col1} - {col2}: {corr_value:.2f}")
Model Performance
| Model | Accuracy | Precision | Recall | F1-Score |
|---|---|---|---|---|
| Logistic Regression | 82% | 86% | 90% | 88% |
| Random Forest | 84% | 87% | 92% | 89% |
| CatBoost | 84% | 87% | 91% | 89% |
Business Impact
If deployed by a telecom with 100K customers: Prevent ~26,500 churns annually at baseline rate. Model can identify 61% of at-risk customers before they churn. Focus retention efforts on top 20% highest-risk customers.
What I Learned
Technical
Real-world data is never clean. Having clean and well-structured data is important. Feature engineering matters.
Product
Model explainability matters more than accuracy for stakeholder buy-in. Risk segmentation (High/Medium/Low) more actionable than raw probabilities.
Lamborghini Web3 Campaign Analytics
8-month NFT program: Real-time sales optimisation through data
Context
Led analytics for Lamborghini's 60th Anniversary NFT campaign. Needed to optimise monthly drops in a bear market ("2022 crypto winter") using real-time performance data.
Data Architecture
- •Etherscan API: On-chain transaction data (2.7K NFTs sold)
- •GA4: Web analytics (520K site visits)
- •Discord & Meltwater: Community sentiment tracking
Impact
Analysis revealed 48-hour post-drop engagement dip → Recommended live AMAs + anniversary tie-ins → +9% sales increase in subsequent drops (despite bear market). Final results: $12.2M AVE, 10.5x ROI over 8 months,16th Annual Shorty Awards Winner (NFTs category).
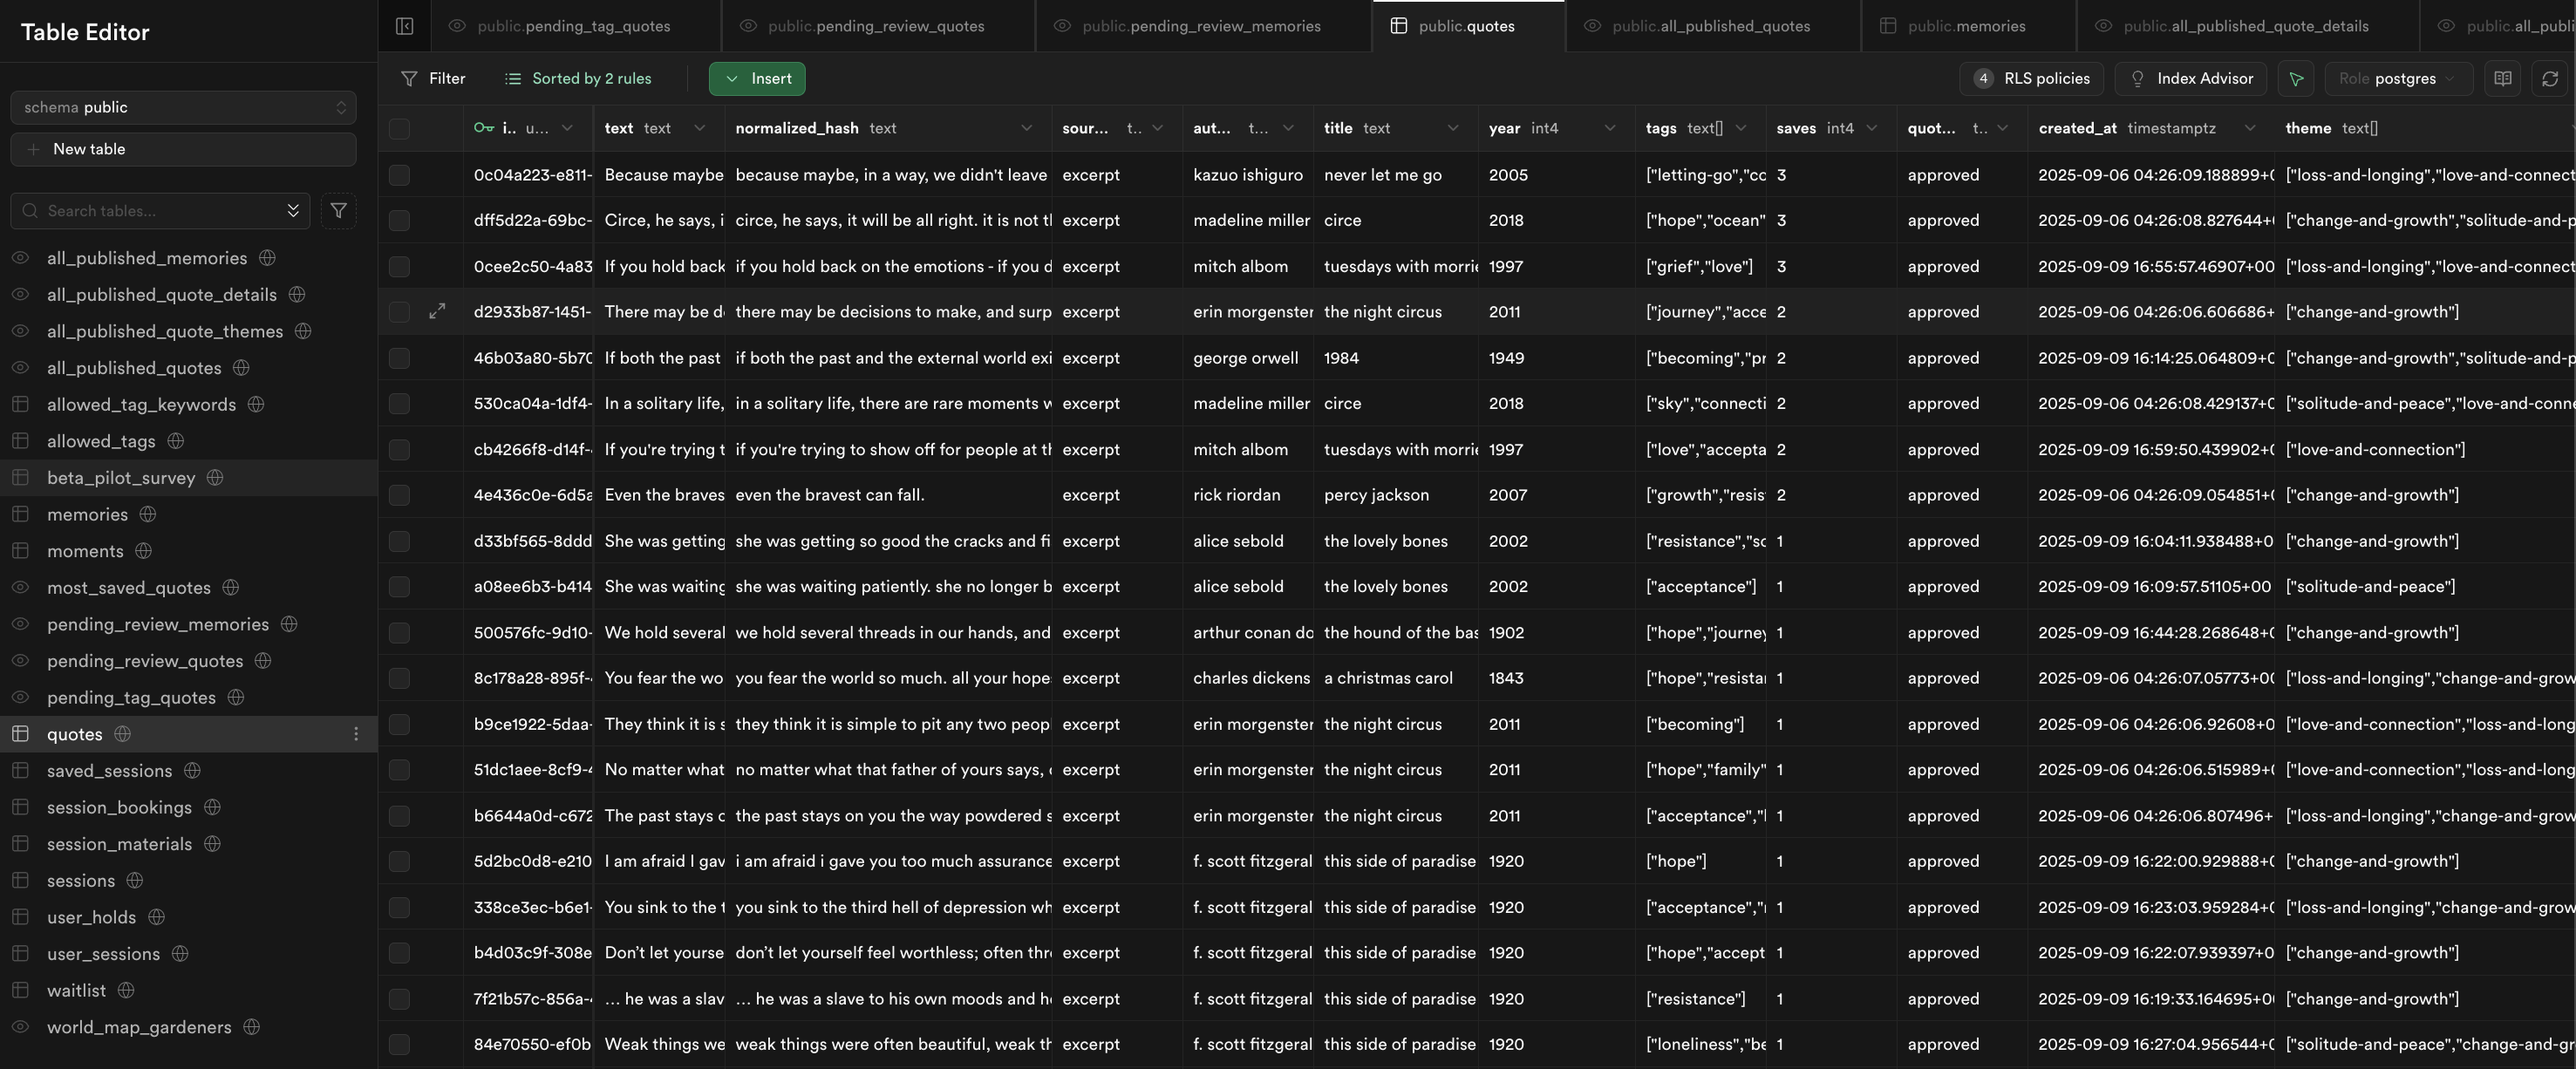
Lento: Quote Repository Platform
Real-time collaborative platform with Supabase tracking
Database Architecture
Built platform for submitting and curating quotes with real-time sync, bot protection, and user behavior tracking. Core schema includes users, quotes, and contribution tables with proper indexing and Row-Level Security (RLS) policies.
Tech Stack Choices
- •Supabase: Handles database + real-time sync
- •n8n agentic flow: Categorise quotes using OpenAI API + real-time sync
- •Cloudflare Turnstile: CAPTCHA reduced spam by 94%
- •Vercel KV: Edge caching reduced DB load by 60%
Key Insights
Tutorial completion → higher submission rate. Quote submission spam detection if over-strict → lower submission rate.
n8n: Automation Workflows
Rule-based data pipelines and reporting
Example Workflows:
- •Weekly Project Status: CRON trigger → Fetch latest project information → Query database → Update visualisation → Email stakeholders
- •Chatbot Knowledge Retrieval: Query → Vector search → Context injection → LLM response → User
Skills & Tools Matrix
Evidence-based proficiency across analytics stack
| Skill | Level | Evidence |
|---|---|---|
| AI Tool Proficiency | Intermediate-Advanced | Gemini, Claude Code, Perplexity, Figma Make, ChatGPT, etc. |
| SQL, Python, ML Pipeline, Data Visualisation, Cloud Deployment | Intermediate | Preference to query raw data and transform through Jupyter Labs with Python. pandas, numpy, matplotlib, seaborn, scikit-learn. Built end-to-end ML pipeline with deployment. |
| Automation | Intermediate | n8n workflows for analytics pipelines, reporting, alerts. Python scripts for ETL. |
Specific Data & Analytics work
See SQL and Python projects